🧮 Controlling the RGB Bands#
The ipyleaflet and folium tile layer utilities support setting which bands
to view as the RGB channels. To set the RGB bands, pass a length three list
of the band indices to the indexes argument.
Here is an example where I create two tile layers from the same raster but viewing a different set of bands:
import localtileserver as lts
from localtileserver import examples
from ipyleaflet import Map, ScaleControl, FullScreenControl, SplitMapControl

# First, create TileClient using example file
client = examples.get_landsat()
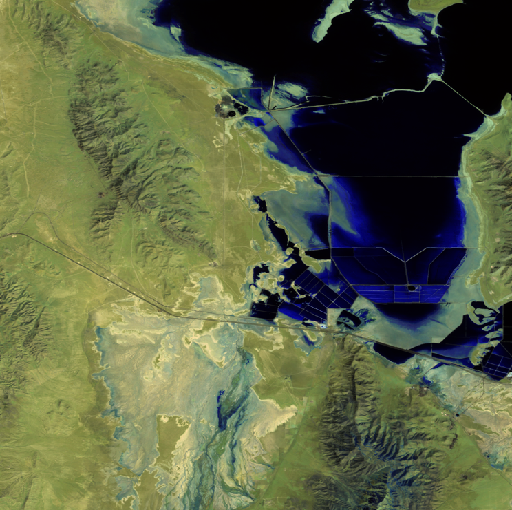
client.thumbnail(indexes=[7, 5, 4])
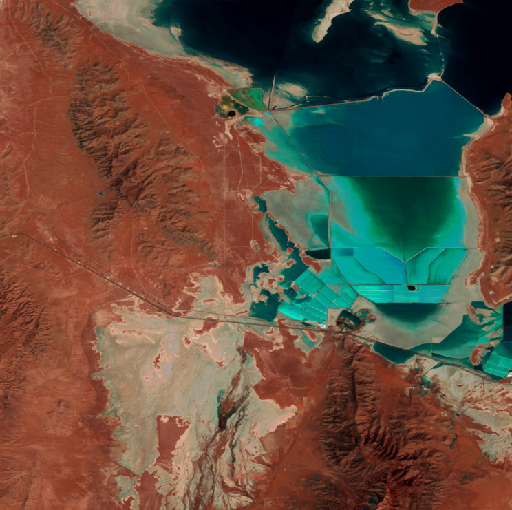
client.thumbnail(indexes=[5, 3, 2])
# Create 2 tile layers from same raster viewing different bands
l = lts.get_leaflet_tile_layer(client, indexes=[7, 5, 4])
r = lts.get_leaflet_tile_layer(client, indexes=[5, 3, 2])

# Make the ipyleaflet map
m = Map(center=client.center(), zoom=client.default_zoom)
control = SplitMapControl(left_layer=l, right_layer=r)
m.add_control(control)
m.add_control(ScaleControl(position='bottomleft'))
m.add_control(FullScreenControl())
m